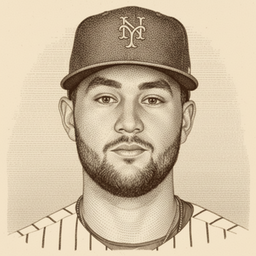
Bo Bichette
Bichette is a buy — the contact is climbing and the sample is big.
His hard-hit rate has stepped up across the sample and now sits at 41.7%, above the 40.0% league average on 518 batted balls, well past the 50 it takes to trust it. His expected wOBA is .330, .015 above the league average of .315, and it has been rising too — on 696 plate appearances, that number is stable. His actual wOBA is .309, slightly below league, so the surface trails the skill; the line has room to catch up rather than give anything back. He strikes out 18.2% of the time, comfortably below the 22.0% league mark, which keeps his average from sagging. The one soft spot is a 40.9% chase rate that will cost him some ugly at-bats, but that does not touch the verdict. The production is earned. Buy.
VS His Norm
- Barrel %6.4%—−1.4% ▼vs his ~7.8% career norm
Drivers
- xwobaSIGNALstable xwOBA 0.330, +0.015 vs league — production is earned
- hard_hit_pctSIGNALelite, already-stable contact quality
5×5 ROS Outlook
rest of seasonWhere each category goes the rest of the way, and the skill that drives it. Tap a row to expand the full derivation.
Every projection traces to a sabermetric input. The driver and confidence shown per row are always visible; tap any row to expand the full derivation.