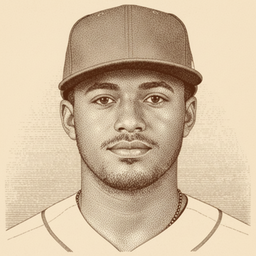
Dane Myers
Myers is a hold — league-average skill, and the average is soft.
His expected wOBA is .309, .006 under the league average of .315, and with 334 plate appearances he has cleared the sample threshold where that number can be trusted. The actual line reads .324, .015 above where his contact quality says it should sit, and the reason is his BABIP: .328 against a league average of .295, across 212 balls in play when the stat needs around 800 before it means anything. Expect some of that average to come back. The contact profile backs the modest read — 89.2 mph average exit velocity is right at league, and his 36.3% hard-hit rate and 4.7% barrel rate both sit under league. He does walk 11.1% of the time, well above average, and he chases less than most hitters. His expected wOBA has been stepping down across the sample, so there is no growth story to buy into. This is a league-average bat, and the surface will drift toward it. Hold.
VS His Norm
- Barrel %4.7%—−2.9% ▼vs his ~7.6% career norm
Drivers
- xwobaSIGNALskill near league average (0.309)
- babipNOISEBABIP 0.328 sits above league and is not yet stable — expect some of the average to regress
5×5 ROS Outlook
rest of seasonWhere each category goes the rest of the way, and the skill that drives it. Tap a row to expand the full derivation.
Every projection traces to a sabermetric input. The driver and confidence shown per row are always visible; tap any row to expand the full derivation.