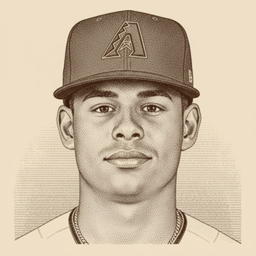
Jorge Barrosa
Barrosa is a sell-high — the surface line is built on BABIP
His actual wOBA is .277, but that number is being held up by a .265 BABIP. BABIP needs around 800 balls in play to be reliable and he has 109, so the gap is luck, not skill. His expected wOBA is .238 — .039 below the surface — and that gap is the regression coming. The contact quality backs the lower number: 87.1 mph average exit velocity and a 23.9% hard-hit rate, both well below league, on a sample past the stabilization point. His expected wOBA has been stepping down across the sample, not flattening out. He strikes out 26.4% of the time, which caps the batting average even when the bounces go his way. The line looks respectable; the skill underneath does not. Sell high. Sell into a 0 HR / 0 R / 0 RBI / 0 SB / .000 AVG projection — deep-league streaming-only, the drop is the trade.
Drivers
- babipNOISEBABIP 0.265 far above league and nowhere near stable — inflating the line
- xwobaSIGNALluck-free skill 0.238 is 0.039 below the surface — regression coming
5×5 ROS Outlook
rest of seasonWhere each category goes the rest of the way, and the skill that drives it. Tap a row to expand the full derivation.
Every projection traces to a sabermetric input. The driver and confidence shown per row are always visible; tap any row to expand the full derivation.